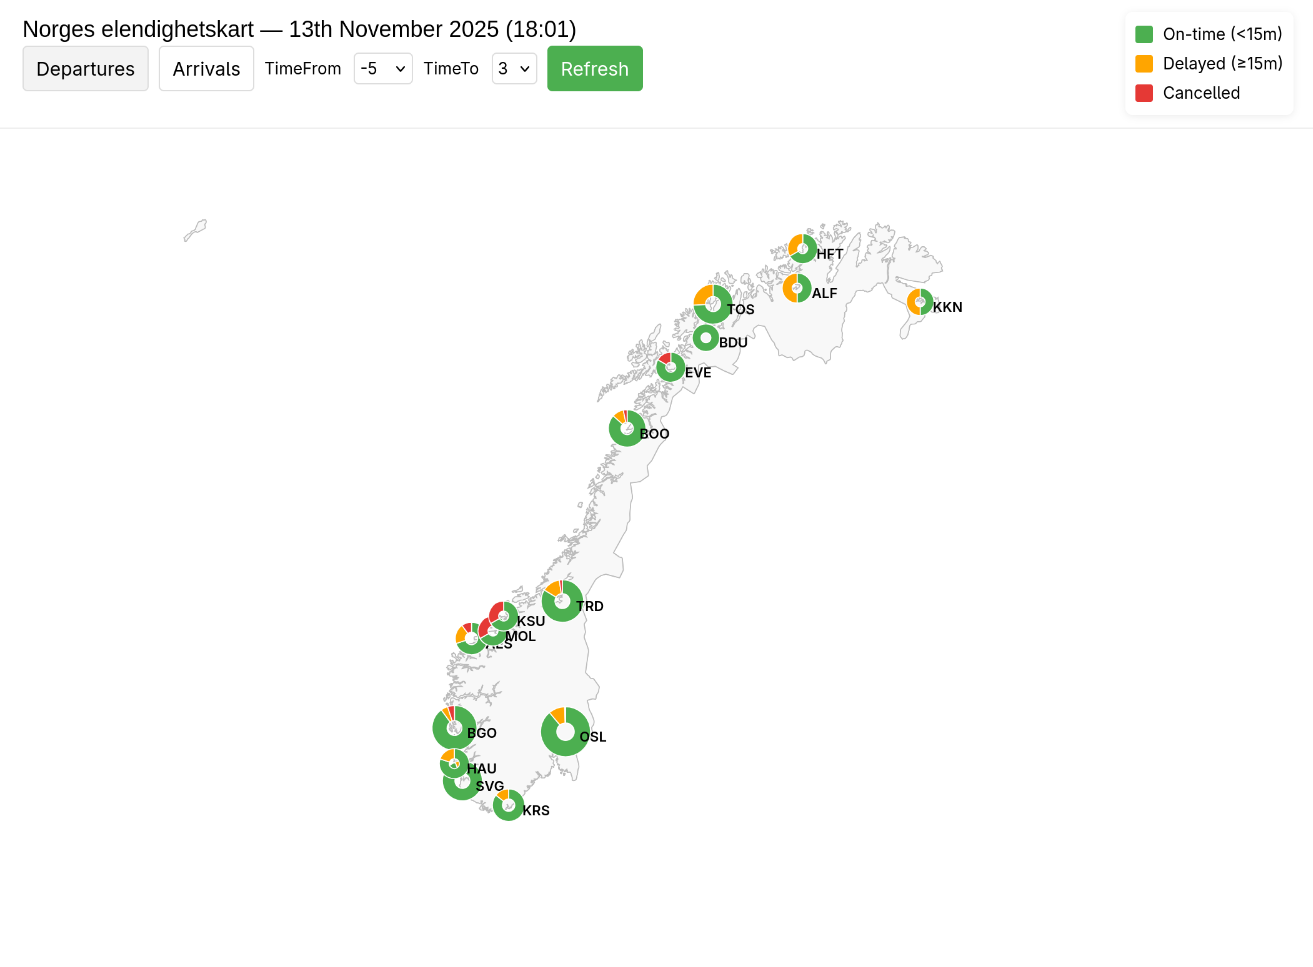
Map of aviation delays in Norway
Motivation
Have you ever arrived at the airport, blissfully unaware, and suddenly found yourself submerged in chaos — a sea of people struggling with delays and cancellations? It is an absolute nightmare, and it happens to me regularly. To the extent that I have started looking up FlightRadar24 and Avinor's website to see what to expect prior to my arrival at the airport.
![Reporting on the European cyberattack of September 2025 which caused several delays and cancellations in Europe. Courtesy of NRK [1].](/assets/images/blogposts/map-of-aviation-delays-norway/cyberattack.png)
![Several hundred passengers stuck in Bergen due to delayed flights caused by drone sightings in Oslo. Courtesy of NRK [2].](/assets/images/blogposts/map-of-aviation-delays-norway/chaos_drones.png)
I stumbled upon FlightAware's Misery Map® and got inspired; I decided to create something similar for the Norwegian airports, so that I can always know what to expect when heading to catch my next flight.
Architecture
The architecture is fairly simple, and is based on D3.js for data visualization and W3.CSS for the stylesheet.
Avinor exposes a set of APIs that can be easily queried to obtain all the information we need to build the console. We just need a small middle layer to handle CORS requests, and possibly aggregate it so that we do not need to perform a request for every airport.
Avinor APIs
The official API documentation can be found here, but I report here a brief summary of the query parameters and the response attributes.
Request:
| Parameter | Description | Example |
|---|---|---|
airport |
IATA code of the airport of interest. Mandatory | airport=OSL |
TimeFrom |
How many hours in the past to filter (positive, default=1) | TimeFrom=2 |
TimeTo |
How many hours in the future to filter (positive, default=7) | TimeTo=5 |
direction |
A=Arrivals, D=Departures, no value=both | direction=D |
lastUpdate |
Load only flights that have been updated more recently than the specified time. Optional. | lastUpdate=2024-08-08T09:30:00Z |
codeshare |
If included, also codeshare information is returned. Optional | codeshare=Y |
serviceType |
E=include Helicopters, J=helicopters and service passengers, C=charters. default=only service passengers | serviceType=E |
Notice that the request is airport-specific. Therefore, a request needs to be made for every single airport.
Response:
| Response | Description | Example |
|---|---|---|
uniqueId |
Unique identifier. Max 12 numbers. | 1617049968 |
lastUpdate |
Last update (edit) to the data | 2024-08-09T07:05:00Z |
flightId |
Flight codename | SK4167 |
dom_int |
D=domestic, S=Schengen, I=international | D |
arr_dep |
A=arrival, D=departure | D |
schedule_time |
Arrival/Departure scheduled time | 2024-08-09T07:05:00Z |
airport |
Arrival/Departure airport (the other airport) | BGO |
airline |
IATA code of the airline | SK |
via_airport |
Stops in IATA format, comma separated, max 10. Final destination not included | SVG, BOO |
check_in |
Check-in area if provided | 1 2 3 |
gate |
Gate if provided (departure only) | B18 |
belt_number |
Arrival belt if provided (arrival only) | 9 |
status code |
A=arrived, C=Cancelled (or diverted), D=departed, E=new time, N=new info | A |
status time |
Status time, relative to the code provided | 2024-08-09T07:05:00Z |
Cloudflare workers
Cloudflare Workers are a serverless platform executing JavaScript snippets. Exactly what we need.
On the free plan we can process up to 100,000 requests a day, with a limitation on CPU time of 10 milliseconds per request.
Avinor's API is not configured for CORS requests, and therefore cannot handle direct-browser requests from arbitrary origins. The Worker fetches data from Avinor server-side, so the browser can safely call the Worker endpoint without running into CORS restrictions. Additionally, by the way the API is built, we need to query every single airport in Norway. Instead, I delegated this operation to the worker, who calls the API asynchronously and returns an aggregated result.
To reduce request volume to Avinor and make the UI faster, the Worker implements short-lived caching. The Worker sets appropriate Cache-Control headers and leverages the Cloudflare cache API to store JSON responses for a short TTL (in my case 60 seconds). This reduces API calls to Avinor while keeping data near real-time.
LLM usage
Although I enjoy coding, especially if it is a data-driven project, I do not particularly enjoy UI-building and having to deal with HTML/CSS. JavaScript is also not my favorite programming language (clearly). So I took it as a good chance to see how far I could push agentic AI to help me build such a dashboard.
I knew already how I wanted to structure the project (W3.CSS + D3.js + Avinor's API + Cloudflare workers) so I described exactly how the API worked and what I wanted for a starting point and let the LLM do its magic.
The first result was usable but needing several BIG improvements. In particular:
-
The agent tried to use the World Atlas TopoJSON in the form of
countries-10m.json, which was nowhere near fine enough for good visualization. I changed it tocountries-110m.jsonand filtered the file to keep only the features for Norway to make requests lighter. -
The UI was there, but it was frankly quite terrible. The LLM tried to custom-make CSS code instead of using W3.CSS as instructed. But this was easily fixed.
-
Although it had been fed the documentation on the API, it still applied the wrong logic to some of the data processing. For example, it mixed up departure and destination airports, and incorrectly classified cancelled flights.
-
The default value for caching was set at 12s. I updated it to 60s, which is better but potentially still quite low.
Overall, it compressed the required workload from several days of painful UI-building to a few hours of high-level thinking and some debugging. So I am quite happy with this experiment.
Still, horizontal centering through CSS seems to be godly work that is beyond the capabilities of an LLM. Let's not talk about vertical centering.
Future developments
I would have loved to include a weather overlay, such as precipitation data coming from meteorological radars or nowcasting computed by the Norwegian Meteorological Institute. Unfortunately, I could not find such data for Norway readily available except as tiles that need to be processed and stitched together. I decided to leave it for another time.
I also thought the interactive visualization of the traffic streams on FlightAware's map was pretty cool, but that was way above my UI knowledge to implement and I did not dare asking the LLM to assist me with that. Maybe I will try to implement it at a later time.
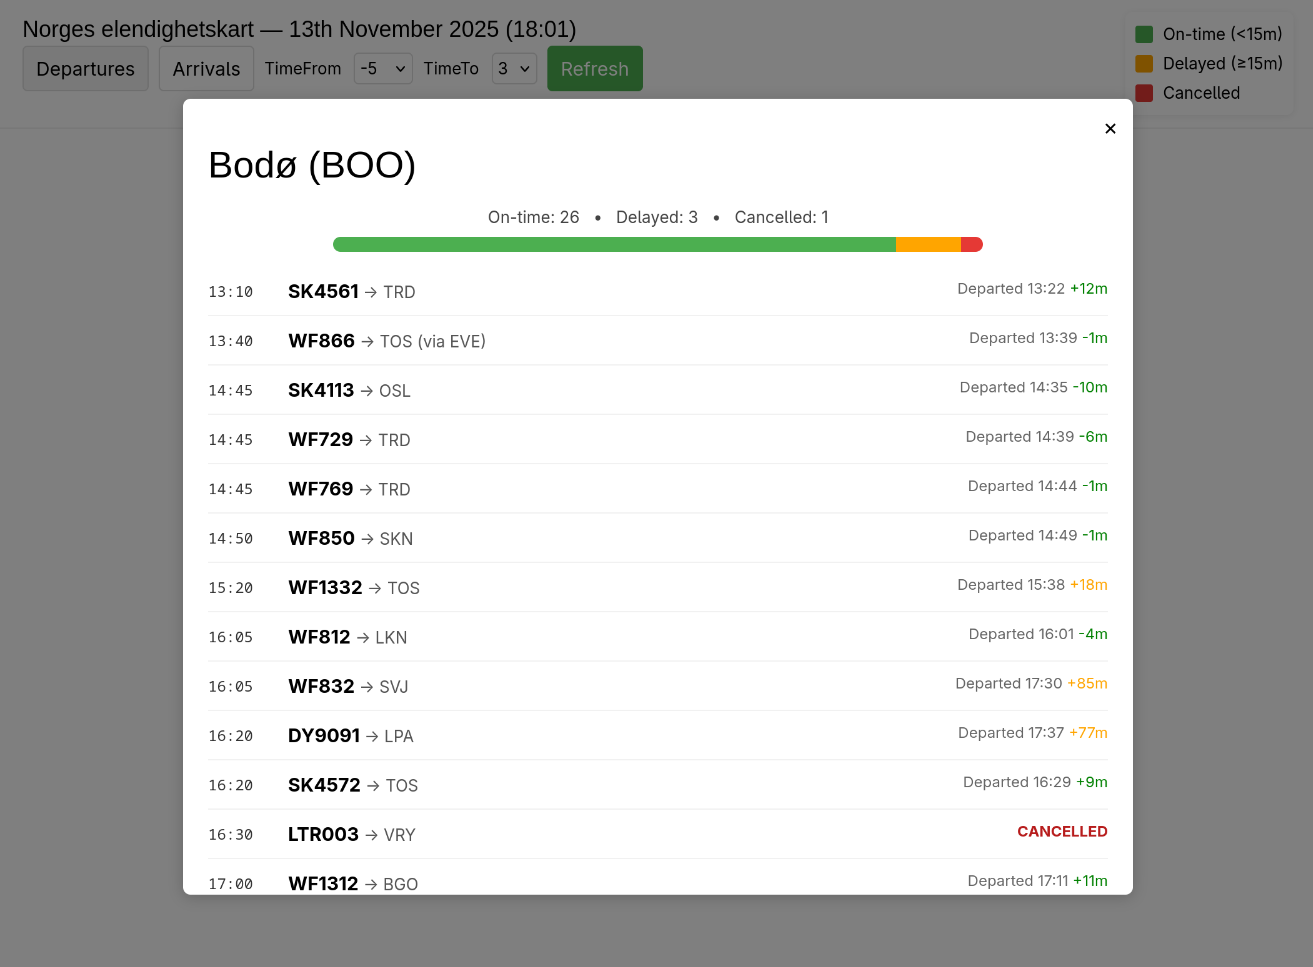
Final results with live demo
The live demo page can be found HERE. Take a look at it!
Below are some screenshots.
References
[1]: https://www.nrk.no/urix/cyberangrep-mot-europeiske-flyplassar-1.17578597